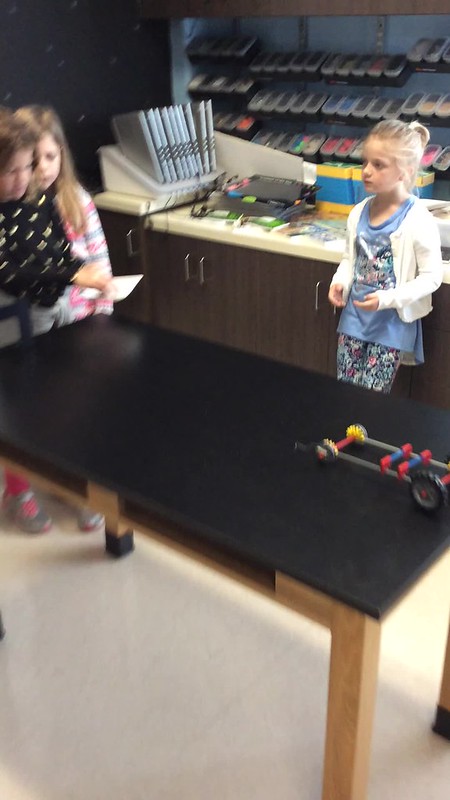
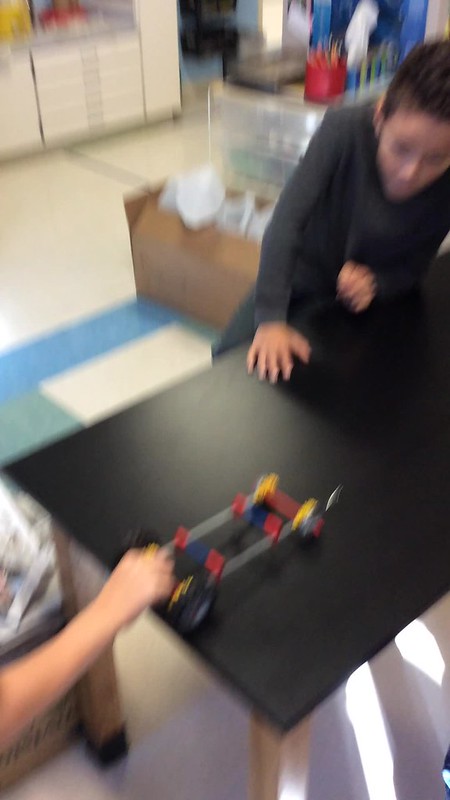
A bit lazy on the title I know, but I’m running out of STEAM. Get it!? (cue crickets chirping) Eh . . . anyway . . . let’s take a gander at first graders who continue applying their know-how about forces, pushes, and pulls. This lesson centered on pulls with the use of weight and gravity; much like what pulls glaciers if we recount to the last post with 4th grade’s topic. These first graders tinkered with adding and/or subtracting the amount of washers to their vehicle by connecting them via string & paperclips. After exploration time with the vehicles and the weights, the students repeated the activity beginning with one washer, then 2, 4, 6, and 8 writing down observations between each trial as to which provided the greatest/fastest pull, and why they believed this to be true. We’ll pick up with this activity and review our discoveries in the next post.
Moving on to 5th where our marine biologists are using bathymetric sonar technology to map the ocean floor. NOAA’s ship, the Okeanos Explorer, uses this type of sonar which flares out onto the ocean bottom, pinging data back to the ship in a color coded scale to outline trenches, volcanoes, sunken ships, etc. These students constructed models of the abyss and/or trenches which they are preparing for another class. Pictures of them sampling data by use of color coded straws are models built by another 5th grade class. The lower the straw, the deeper the coordinate. After recording the data the next step will be to transfer the information to a color bar graph, one sheet per column (columns were from A-J). After the bar graphs are made for each column the students will cut, and glue the data in their journals to create a three dimensional pop-up scale. We will have pictures once this is complete, so stay tuned and until then check out the pictures and video.


